Every November everyone wants to know how high season will go. Four books on decisions and uncertainty offer something more useful than a forecast: a method to build your own, adjust it, and decide well even when the future surprises you.
Around this time of year, the same question comes up in every meeting in the Riviera Maya: how is high season looking? And next year? Hotel owners, restaurateurs, real estate agents and service providers all place their bets on what is coming.
Nobody has the exact answer. What does exist is a way of thinking that improves forecasts and, above all, the decisions made with them. Daniel Kahneman studied it in Thinking, Fast and Slow, Philip Tetlock and Dan Gardner in Superforecasting, and Annie Duke in Thinking in Bets and Quit. These are the lessons that apply best to a business in this region.
1. Start with what usually happens
Before asking what makes this season special, look at what happened in the previous ones. Tetlock calls this starting from the base rate: the data from similar cases comes before the particular story.
The Riviera Maya has a good base rate. From 2015 to 2019, Cancún airport grew an average of 6.8% a year. In 2023 it hit its record, 32.75 million passengers, almost exactly what it would have reached on that same trend. It closed 2025 at 29.3 million, still 15% above 2019. And from January to September 2026 it adds up to 20.88 million, 5.9% below the same stretch a year earlier.
With that in view the conversation changes. It stops being "I think it will be great" or "I think it will be terrible" and becomes a question about how far from its trend the region is today, and why.
2. Break the big question into small ones
"How is the season looking?" is too big to answer well. It helps to split it into pieces you can actually watch:
- How many airline seats are scheduled into Cancún for the winter?
- How is hotel occupancy running week by week?
- How many bookings, quotes or appointments does my business already have for December, January and February, compared with last year?
The last one is the most valuable, because it is the one only you can see. Regional data tells you how the tide is coming in; your own tells you how your boat is doing.
3. Speak in probabilities
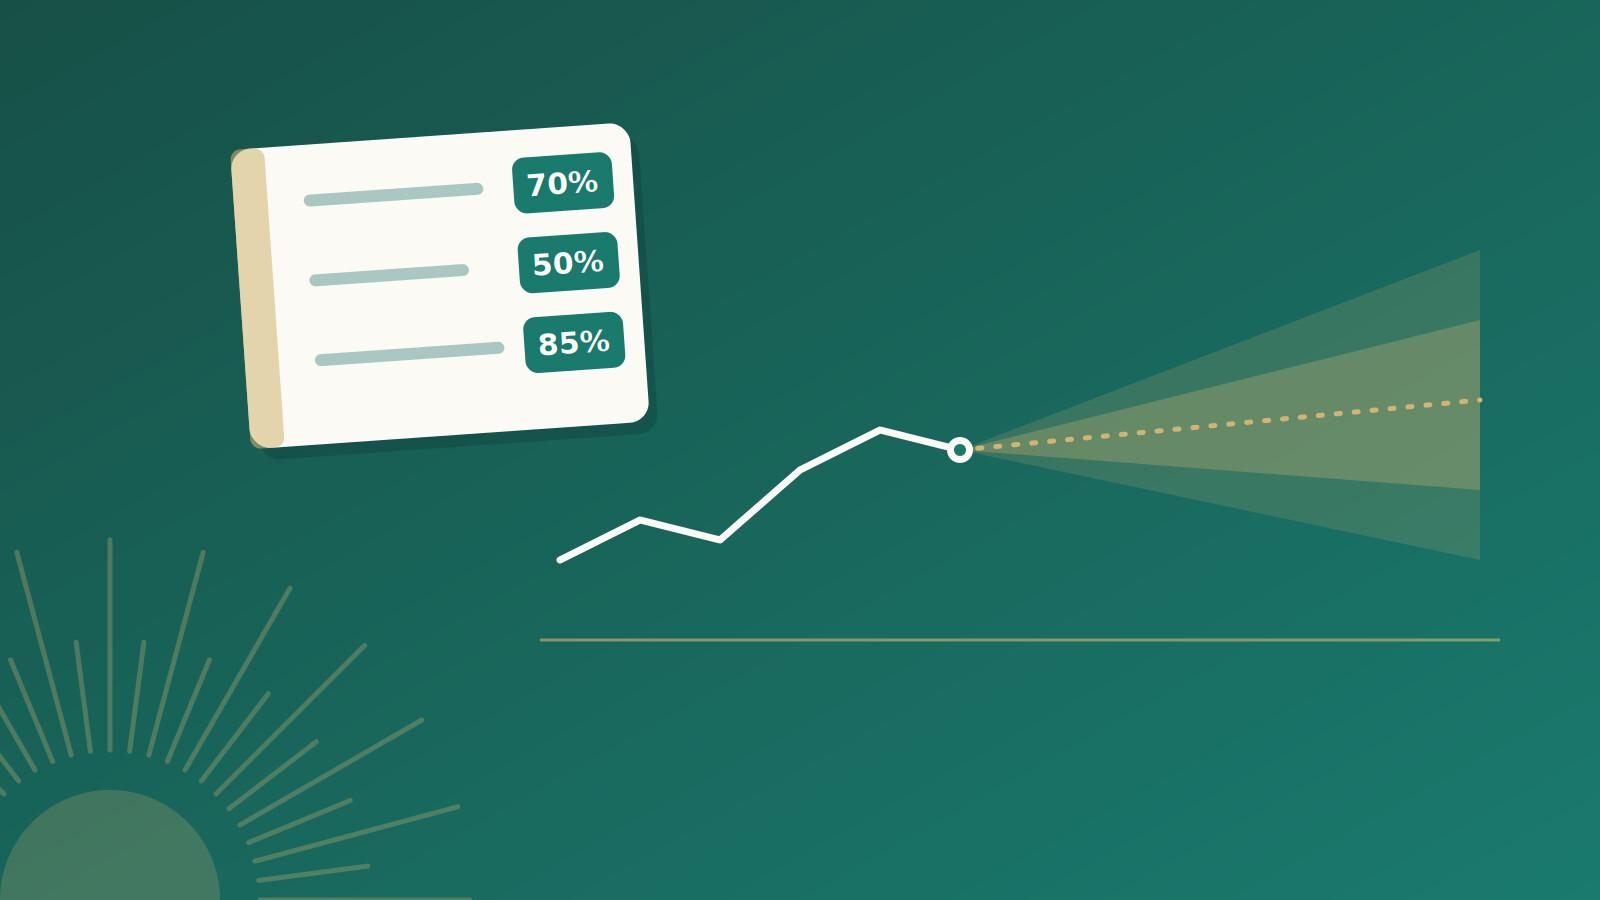
"It is going to be a great season" cannot be checked. "I think there is a 70% chance December outsells last year" can. Putting a number on a belief forces you to think about what holds it up, and lets you measure afterwards whether you were right.
A simple exercise: write down five forecasts about your business for the season today, each with its probability and its review date. Put them away. In April, compare them with what happened.
4. Update every month
Changing your mind when new data arrives is not inconsistency. It is exactly what the best forecasters do. The region publishes information every month, so there is material to adjust with: ASUR releases its passenger report in the first days of the following month, and hotel occupancy is reported weekly.
Set a fixed date, the 10th of each month for instance, to go over your five forecasts with whatever is known by then.
5. Judge your decisions by how you made them
Annie Duke, a former professional poker player, insists on separating the quality of a decision from its outcome. Hiring one more person for the season can be a good decision even if the season turns out weak, as long as you made it with the best information available and with a plan to adjust. And it can be a bad decision even if it turns out well, if it was pure luck.
For the big calls of the season, like hiring, stocking inventory or opening a new service, ask yourself three things: what do I gain if it goes well, what do I lose if it goes badly, and how likely is each one.
6. Decide today when you will correct course
In Quit, Duke suggests setting the exit rule before you start, while your head is cool. For example: "if by January 15 February's bookings are not ahead of last year's, I cut the extra shift." Deciding it beforehand keeps you from staying in a plan only because you already put money into it.
What your forecast table looks like
Each row carries four things: the forecast, its probability, the data that would change your mind, and when you will review it. Two examples, with made up percentages so you can see the shape:
- December outsells last year. Probability 70%. Bookings as of November 30 would change it. Reviewed December 10.
- January fills 80% of my capacity. Probability 50%. December's hotel occupancy would change it. Reviewed January 10.
The percentages are an example. Put in your own.
Thinking out loud, with other people
Duke recommends surrounding yourself with people who want to get it right together, rather than win the argument. That is what the Mesa Kiin is for: business owners from the region sharing what they see in their own numbers, so each of us adjusts our forecast with more information than our own. If you want to come, write to us from kiinhubcowork.com.
Sources: ASUR, passenger traffic reports, including the fourth quarter 2015 report and September 2026; Riviera Maya Economic Pulse, Cancún air traffic series; Philip Tetlock and Dan Gardner, Superforecasting (2015); Annie Duke, Thinking in Bets (2018) and Quit (2022); Daniel Kahneman, Thinking, Fast and Slow (2011).
Share this article